Project Description:
Acquired and Applied Knowledge:
In this project, I got the chance to review a lot of content and expand upon that content. Specifically, I learned more about Mendelian inheritance and the process of evolution and domestication. I was able to incorporate these factors into my project by focusing on "nature v.s. nurture" on the topic of the American Pit Bull Terrier. During exhibition, I was able to discuss this topic with many community members, coming to the conclusion that genetics can only take behavior so far, but the majority of influence comes from the environment that animal was raised in and the environment it is currently in.
Class Slideshows:
Example of Lab Reports:
|
|
|
|
My Project:
Lab Report:
My Question:
What are the variables that affect adoption rates?
What are the variables that affect adoption rates?
Data Set:
Final Product: Infographic
Infographic Sources:
My Product Explained:
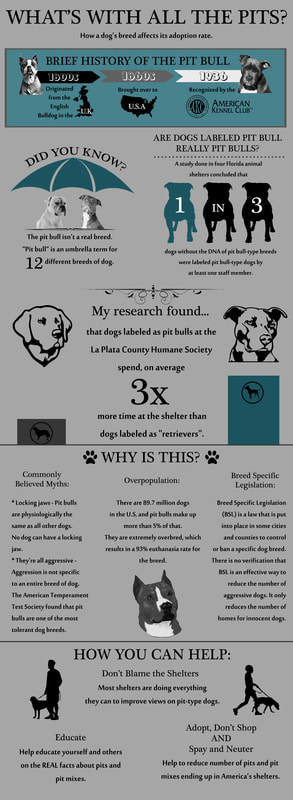
My project focused on the difference between adoption rates for dogs labeled as "retrievers" v.s. dogs labeled as "pit bulls" in our local shelter, the La Plata County Humane Society. I picked this topic because I am a pit bull advocate and was very interested in seeing the effects of negative media, overpopulation, and BSL in my own community.
I collected my information by accessing the Humane Society's adoption and intake data for the month of October of 2017. I analyzed this data by plugging it into my "Data Set" spreadsheet (as seen above) and finding the average amount of time that each breed stayed at the shelter in that month. I then shrunk my data findings to put focus onto "retrievers" and "pit bulls".
My data found that dogs labeled as "pit bulls" at the La Plata County Humane Society spend, on average, 3x more time at the shelter than dogs labeled as "retrievers".
If I were to continue this project, I would go on to ask the question, "What are the main factors that affect this data in the Durango community?" I know the factors that can affect this in larger cities and in the U.S. all together, but I do not know which of these factors affect this in my own town. It could differ from, let's say, Denver, CO or Miami, FL.
CHALLENGE EXTENSIONS:
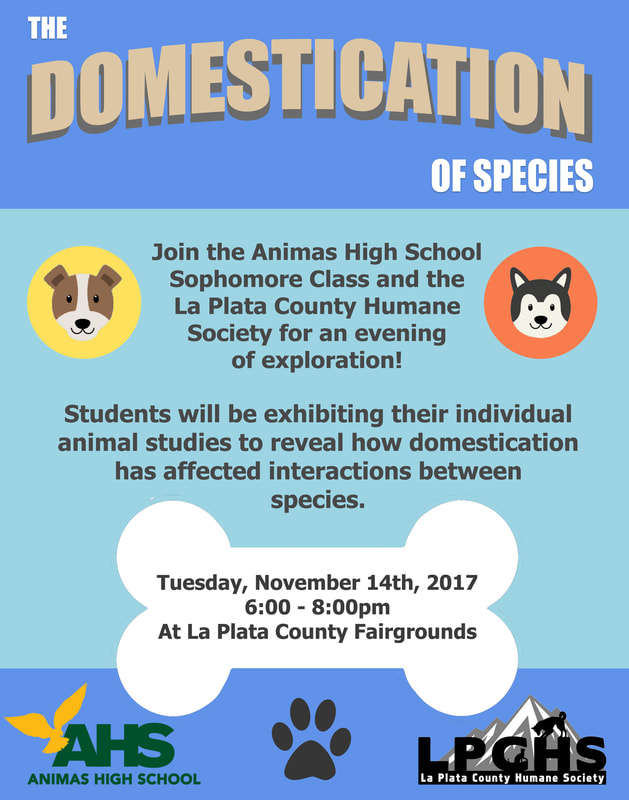
Exhibition Advertisement Poster:
|
I had to create a possible poster to use as advertisement for our exhibition.
|
Exhibition Adoption Posters:
|
|
I had to create posters to decorate our exhibition with. I chose to advertise the adoptable animals from the La Plata County Humane Society.
|
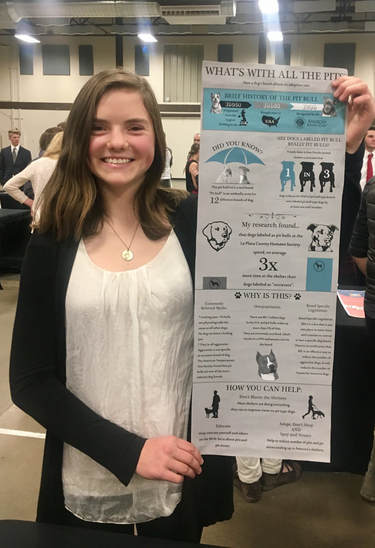
EXHIBITION NIGHT:
|
Exhibition was a success! We had a great turnout and was a fun night full of education.
|
Header Image Site: https://www.pexels.com/search/dog/
